Why Your Website Is Losing Revenue in 2026
Why Your Website Is Losing Customers in 2026: The Hidden Cost of Performance Gaps
Every second your website takes to load, you are handing revenue to a competitor.
Not hypothetically. Measurably.
A one-second delay in page load time cuts conversion rates by 7%. For a US business generating $500,000 in annual online revenue, that single second costs $35,000 per year quietly, invisibly, without a single customer complaint landing in your inbox. They do not complain. They leave. And Google notices before they do.
If your website was built two or three years ago and has not been structurally optimized since, there is a strong probability it is bleeding revenue at this exact moment. This post breaks down where that money is going, why it accelerates in 2026's search environment, and what a serious business does to stop it. If you want to understand the engineering stack behind high-performance sites, start with our web development services but first, read what is actually costing you.
The Invisible Revenue Leak Most CEOs Never See
Performance gaps are not dramatic. There is no error message. No alert. No moment where the business owner realizes something is wrong. The damage accumulates silently through a pattern most analytics dashboards fail to surface clearly.
Here is what is actually happening.
Users do not wait. The average US internet user in 2026 expects a fully interactive page within 2.5 seconds. At 3 seconds, 40% of visitors have already left. At 5 seconds, that number climbs to 53%. These are not edge-case users on weak connections these are your target customers on broadband, making active purchase or vendor evaluation decisions, who simply moved on because the experience did not meet the standard they have been conditioned to expect.
Google's AI Overviews change the ranking economics entirely. In 2026, Google's AI-generated answers pull from a curated index of sources that meet strict quality and performance signals. Slow sites, sites with poor Core Web Vitals scores, and sites with weak semantic content structure are not getting cited in AI Overviews regardless of domain authority or backlink profile. If your site does not meet Google's performance threshold, you are invisible in the highest-visibility position on the results page.
Bounce rate is a compounding problem. High bounce rates signal to Google that users are not finding what they need. That signal suppresses your rankings further, which reduces qualified traffic, which reduces conversion volume and the cycle tightens. Most businesses treat bounce rate as a content problem. In 2026, it is almost always a performance and structure problem first.
What Google Actually Measures in 2026
Google's ranking infrastructure evaluates three Core Web Vitals as primary user experience signals. Understanding these is not optional for any US business that depends on organic search traffic.
LCP Largest Contentful Paint. How long it takes for the main content block of your page to render visibly. Google's threshold for a "good" score is under 2.5 seconds. Most websites built on bloated page builders or unoptimized WordPress themes are sitting between 4 and 7 seconds. Every point above 2.5 is a ranking penalty.
INP Interaction to Next Paint. Introduced as a Core Web Vital in 2024 and now a primary signal, INP measures how quickly your page responds after a user clicks, taps, or types. A slow INP score above 200 milliseconds tells Google your site is sluggish under interaction. For SaaS platforms and B2B service sites where users navigate deeply before converting, this metric is critical.
CLS Cumulative Layout Shift. How much your page visually jumps around as it loads. Unexpected layout shifts destroy user trust instantly and are a direct ranking signal.
The businesses growing their organic market share in 2026 have all three metrics in the green. It is not one or the other. It is the complete performance profile that determines whether Google surfaces your content to high-intent buyers or routes them to a competitor who invested in enterprise web performance. You can see how we engineer for these benchmarks across our client work.
Why Generic Websites Cannot Compete at This Level
Template-based websites built on Squarespace, generic WordPress themes, or low-tier page builders are structurally incapable of achieving elite performance scores at scale. They carry bloated CSS and JavaScript that cannot be stripped without breaking the template. They load fonts, scripts, and tracking pixels in the wrong order. They serve the same image sizes to mobile and desktop. They render everything client-side when server-side or static rendering would be significantly faster.
These are not configuration problems. They are architectural limitations. You cannot tune your way to a 95 LCP score on a foundation that was not designed for it.
The performance ceiling of a generic website is lower than the performance floor of a properly engineered one.
This is precisely why the market has shifted toward bespoke web development for any business that treats its website as a revenue-generating asset. A custom-engineered site has no architectural ceiling. Every rendering decision, every asset delivery strategy, every data-fetching pattern is made deliberately for your specific content structure, your specific user journey, and your specific conversion objectives.
The performance gains are not marginal. Businesses that migrate from bloated generic builds to custom web development services built on Next.js routinely see LCP improvements of 60-80%, bounce rate reductions of 20-35%, and organic traffic recovery within 60 to 90 days of relaunch. We covered the architectural reasons behind this in detail in our piece on migrating from React to Next.js App Router the same rendering principles that make that migration worthwhile are what separates a high-performance site from a generic one.
Bespoke Web Development Is Not a Cost It Is an Infrastructure Investment
The framing most business owners bring to a web development conversation is wrong and it costs them significantly.
"How much does the website cost?" is the wrong question. The right question is: "What is the revenue impact of my current site's performance, and what is the ROI of fixing it?"
Consider the math a US e-commerce or B2B company should actually be running.
If your site converts at 1.8% and a performance-optimized, structurally engineered version converts at 2.7% a realistic and conservative improvement based on documented case data and your monthly organic traffic is 20,000 visitors with an average deal or cart value of $300, that is the difference between $108,000 and $162,000 in monthly revenue. The $54,000 monthly delta compounds. The investment in bespoke web development pays back in weeks, not years.
Custom web development services built on a modern stack React, Next.js, headless CMS architecture, edge delivery networks produce compounding returns because the foundation scales without structural rebuilds. You add features without regression. You launch campaigns without performance degradation. You grow traffic without infrastructure bottlenecks.
This is the same argument we make about custom-built content platforms. As we detailed in why custom WordPress development beats templates, the economics of building correctly the first time always outperform the economics of patching a template that was never designed for your scale. The same logic applies to your entire web infrastructure.
The Technical Bottlenecks Quietly Killing Your Rankings
For the business owners and marketing directors who want to know exactly what to look for, here are the most common technical failures we audit in US business websites.
Render-blocking JavaScript. Scripts that load before your content is visible delay LCP and tank user experience immediately. A properly engineered site defers non-critical scripts, loads them asynchronously, and delivers visible content first.
Unoptimized image pipelines. Serving JPEGs at 2,400px wide to a mobile device at full resolution, with no WebP or AVIF conversion and no lazy loading below the fold. Images alone account for the majority of oversized page weight on most generic websites.
No edge caching or CDN strategy. Serving all requests from a single origin server, often geographically distant from a significant portion of your US user base. A properly configured CDN with edge caching eliminates this latency for static and semi-static content entirely.
Monolithic CMS architecture. Traditional CMS platforms that couple content management to content delivery create rendering bottlenecks at scale. A headless CMS architecture decouples these layers content is managed in one system and delivered via fast APIs to a high-performance frontend. This is now standard practice for any enterprise web performance strategy in 2026. We explored the headless approach in the context of WordPress specifically in our post on custom WordPress development with headless Next.js the performance gains documented there apply across every content-heavy business site.
Animation and interaction overhead. Poorly implemented motion and micro-interactions are a silent INP killer. The difference between a janky interface and a fluid one comes down to the animation engine and how it is implemented. Our breakdown of GSAP vs Framer Motion in Next.js 2026 covers exactly how animation choices affect your Core Web Vitals and our Next.js animations optimization guide documents the implementation patterns that keep motion performant at scale.
Third-party script bloat. Chat widgets, analytics platforms, heat mapping tools, ad pixels, and social embeds each one adds to page weight and can delay Time to Interactive significantly. An engineered site loads these with priority management. A generic one loads them all at once on page initialization.
What a Perfect PageSpeed Score Actually Looks Like in Production
The benchmarks above are not theoretical targets. Here is what Google's PageSpeed Insights returned for a real client site we engineered at Build With Umar BizGrow Holdings audited June 22, 2026.
Mobile Results
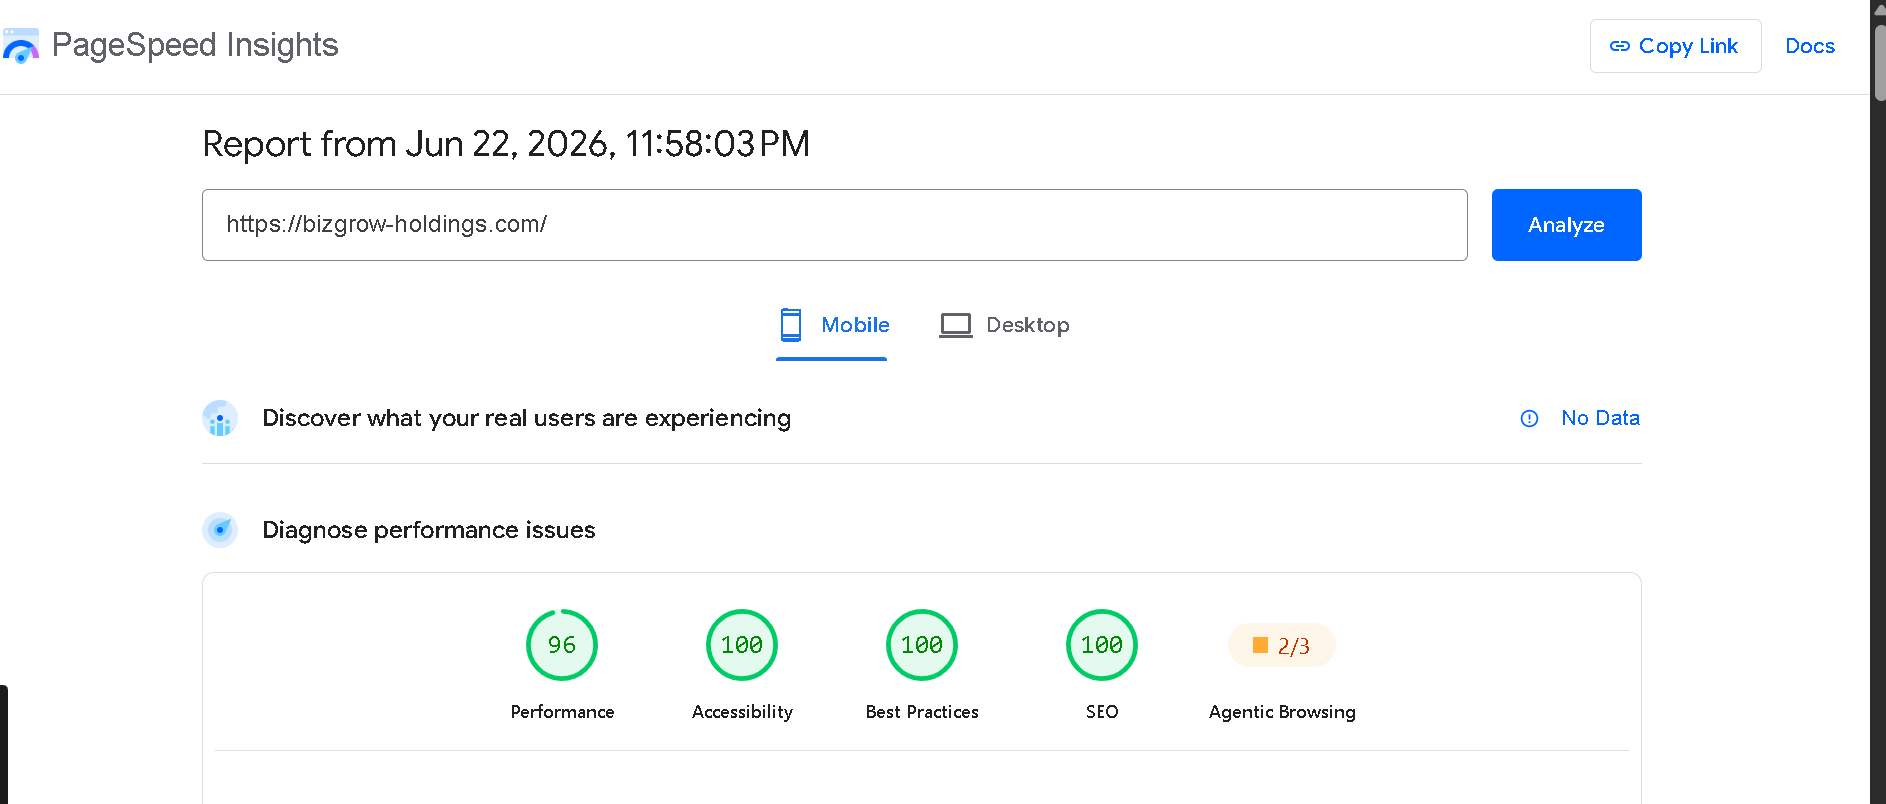
BizGrow Holdings Mobile PageSpeed Insights Performance 96, Accessibility 100, Best Practices 100, SEO 100
Mobile is the harder benchmark. Most agencies optimize for desktop and treat mobile as secondary. We treat mobile as the primary delivery target. BizGrow Holdings scored 96 on Performance, 100 on Accessibility, 100 on Best Practices, and 100 on SEO on mobile the device class Google weights most heavily in its ranking infrastructure.
Desktop Results
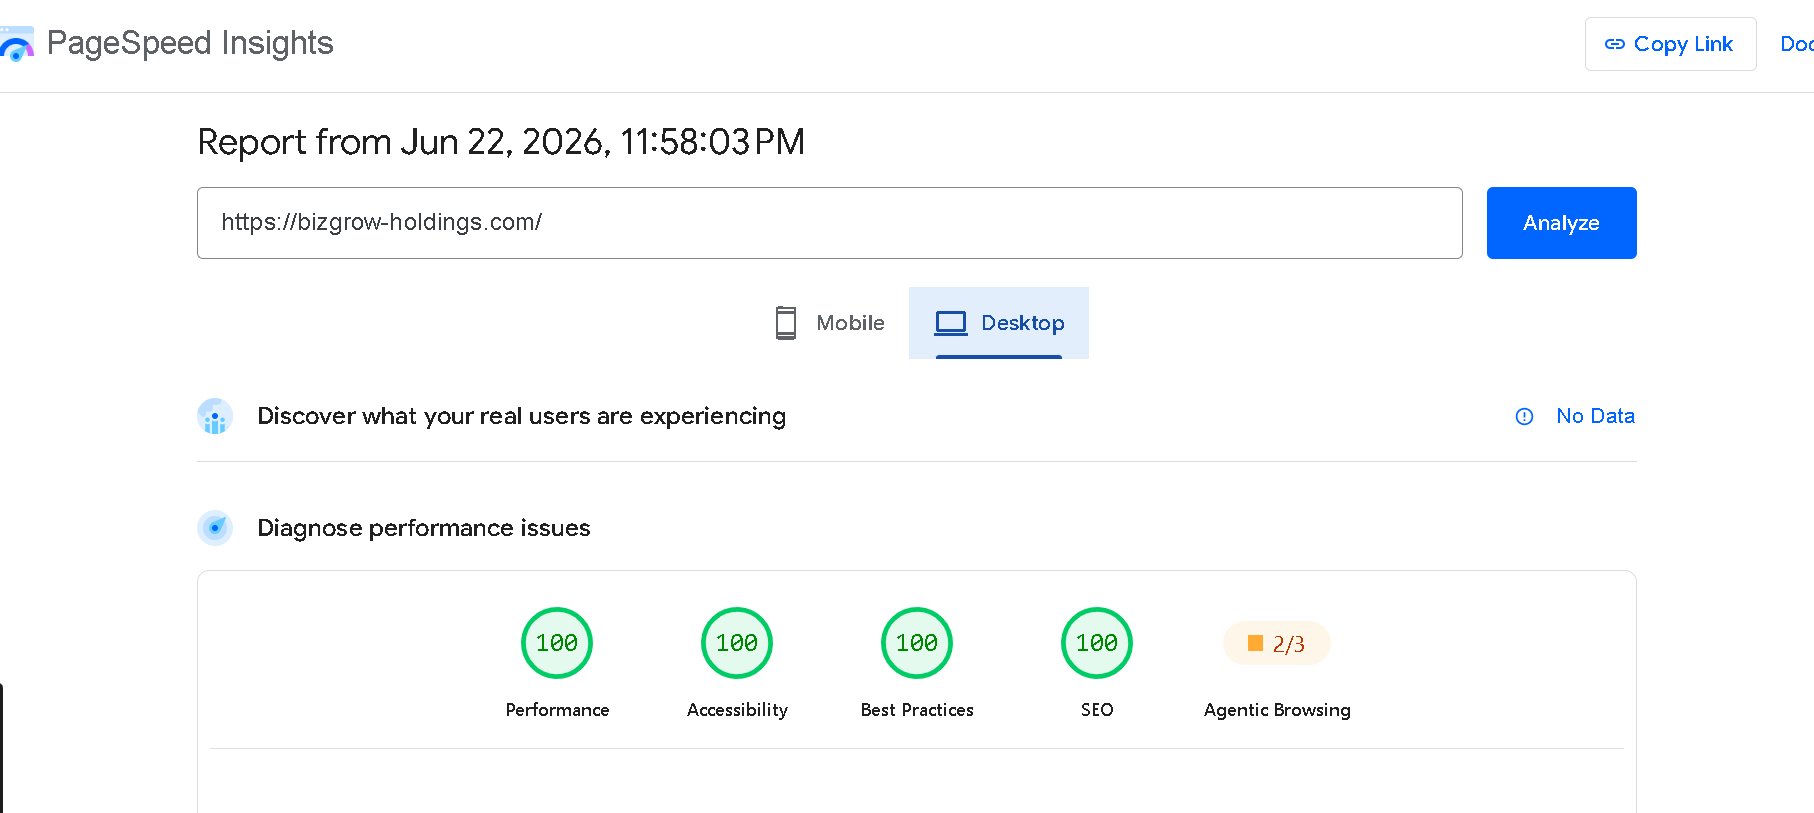
BizGrow Holdings Desktop PageSpeed Insights Performance 100, Accessibility 100, Best Practices 100, SEO 100
Desktop returned a perfect 100 across Performance, Accessibility, Best Practices, and SEO. A clean sweep across every signal Google evaluates at the page level.
This is not a one-off result. It is the output of a deliberate engineering process: server-side rendering via Next.js, edge-cached static assets, optimized image pipelines serving WebP at responsive breakpoints, deferred third-party scripts, and structured data implemented across every key page type.
The Agentic Browsing score of 2/3 reflects an emerging Google evaluation layer for AI agent compatibility a signal that will carry more weight as AI-driven search behavior scales through 2026 and beyond. It is already on our optimization roadmap for every new engagement.
This is what the 2026 standard looks like when it is actually built, not just described. If your current site cannot produce a report like this, the gap between where you are and where your competitors are engineering toward is wider than your analytics are showing you.
The 2026 Standard for US Business Websites
To compete for organic visibility, AI Overview citations, and high-intent buyer attention in the current environment, a US business website must meet these benchmarks.
- LCP under 2.5 seconds on both mobile and desktop
- INP under 200 milliseconds across all interactive elements
- CLS score under 0.1 no layout instability on load
- TTFB under 800 milliseconds server response must be fast before rendering can begin
- Mobile PageSpeed Insights score of 85 or above
- Structured data markup (Schema.org) implemented for all key page types to support AI Overview eligibility
- Semantic HTML and logical heading hierarchy throughout this is how AI crawlers parse content relevance
If your current website does not meet these benchmarks, it is not a question of whether it is costing you revenue. It is a question of how much. Review our work to see what these benchmarks look like in production, or read through our blog for the technical depth behind each decision.
Expert FAQ: Performance, Rankings & ROI in 2026
What is the acceptable load time for US business sites in 2026?
The acceptable LCP benchmark for US business websites in 2026 is under 2.5 seconds, as defined by Google's Core Web Vitals. For competitive markets, top-performing sites are achieving LCP under 1.8 seconds. TTFB should be under 800 milliseconds. Any site loading primary content beyond 3 seconds is operating below the performance threshold required for strong organic ranking and AI Overview eligibility. Mobile performance is weighted equally to desktop and should be treated as the primary benchmark, not a secondary consideration.
How does a headless CMS impact site speed?
A headless CMS improves site speed by decoupling content management from content delivery. In a traditional CMS architecture, every page request triggers a server-side process: database query, content assembly, template rendering, and HTML delivery all in sequence. A headless CMS delivers content via lightweight APIs to a pre-rendered or server-rendered frontend built on a modern framework like Next.js. This eliminates the monolithic rendering bottleneck. Combined with edge caching and static generation, headless architecture can reduce TTFB by 60-80% compared to a traditional WordPress or Drupal stack, directly improving LCP and overall Core Web Vitals scores.
Is custom web development worth the investment for ROI?
Yes when the baseline comparison is accurate. Custom web development services are worth the investment when your current site has a measurable performance gap that is suppressing conversion rates, organic traffic, or both. A conservative 0.5% improvement in conversion rate for a business with $1M in annual web-influenced revenue generates $5,000 in additional monthly revenue. The engineering investment pays back within one to three quarters in most cases. The more accurate framing: the cost of not investing in custom development compounds monthly through lost conversions, suppressed rankings, and the eventual cost of a structural rebuild which is always more expensive than building correctly the first time.
What are the technical bottlenecks most likely hurting my ranking?
The most common technical bottlenecks affecting US business site rankings in 2026 are render-blocking JavaScript that delays LCP, unoptimized images served without modern formats or responsive sizing, absence of a CDN or edge caching strategy causing high TTFB, third-party script bloat loaded without priority management, and missing or incorrectly implemented structured data markup that reduces AI Overview eligibility. A technical SEO audit covering Core Web Vitals, crawl budget, schema implementation, and mobile rendering will surface which of these is the primary constraint for a specific site.
Is Your Digital Infrastructure Costing You Sales?
Most US businesses do not have a traffic problem. They have a performance problem that is masking as a traffic problem.
The qualified buyers are there. The search demand exists. The gap is between what your current website delivers and what the market now requires to convert that demand into revenue.
Schedule a 10-minute performance audit with Build With Umar. We will pull your Core Web Vitals data, identify the specific bottlenecks suppressing your rankings and conversions, and give you a clear picture of what the revenue impact of fixing them looks like in dollars, not percentages.
Book your free performance audit
No pitch decks. No generic reports. Just a straight answer on where your site is losing money and what it takes to stop it. And if you want to understand who you are working with before you book, start with the about page.